Google Analytics gives you lots of ways to segment your site’s data, opening the door to much more powerful analyses. Segmentation is key because there are many dimensions that define your site users and their behavior: location, device type, channel, landing page, etc. The more you drill down into the details, the better insights you’ll get.
Basic segmentation
Many of the default Google Analytics reports are designed to help you segment your data. The “Acquisition > All Traffic > Channels” report (Figure 1 – click to enlarge) is a great place to start. This report shows sessions by traffic source, and right away we can recognize that there are significant differences in the key metrics for each channel. Why do paid search users convert at a higher rate than display ad users? Questions like these become entry points to deeper investigations.
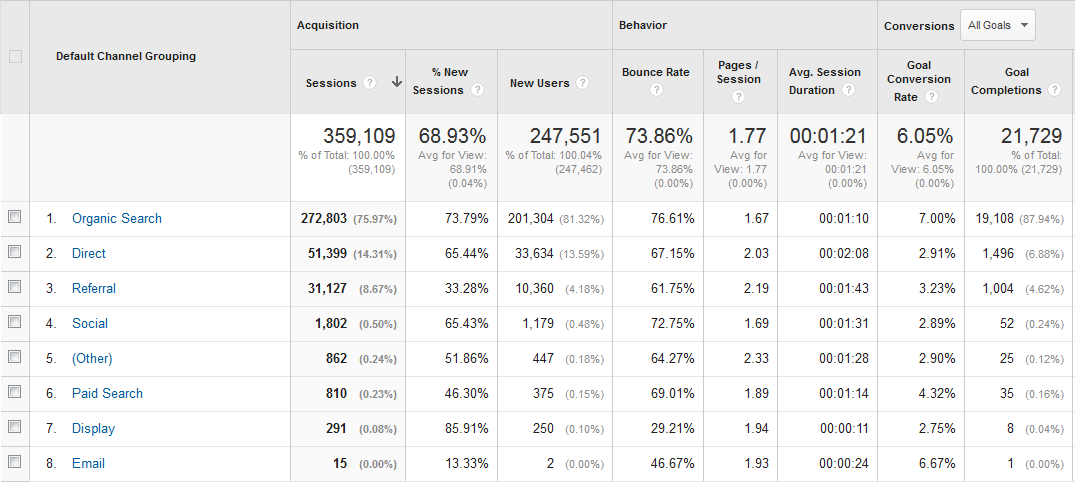
Figure 1
Other useful segmentations are available from the basic Analytics report set. If your business serves a local audience, the “Audience > Geo > Location” report drills all the way down to the town/city level. Find out where your most engaged prospects come from.
Segmentation by landing page is available in the “Behavior > Site Content > Landing Pages” report. Landing pages are those where users entered the Web site. While you may have built special campaign landing pages, it is important to remember that every page can be a landing page. In the example report in Figure 2, it’s helpful to compare bounce rates and conversion rates. Bounce rate is a measure of single-page visits, and high-bounce rate pages are a good target for further investigation into the causes for bounced visits. If you have goals configured for the view, then the conversion rates indicate what percent of sessions included a goal completion action (which do not have to have occurred on the landing page itself, just within the same session). Landing pages have a big impact on conversion as it is their role to engage and persuade users to continue on the path towards goal completion.
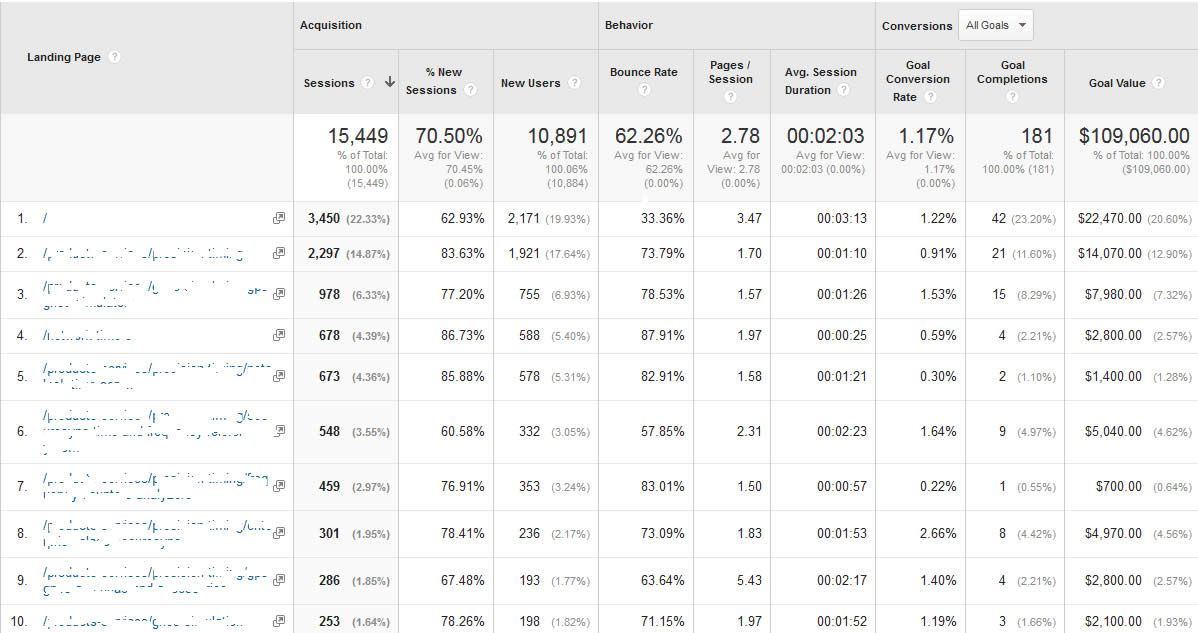
Figure 2
Advanced Segmentation
Most Google Analytics reports have the ability to add “secondary dimensions,” and these are extremely useful for segmenting your data even further. For the landing page example above, I drilled down to a single landing page then added the secondary dimension “Default Channel Grouping” (Figure 3). This lets you see data for the page broken down by channel from which the users came. Very useful!
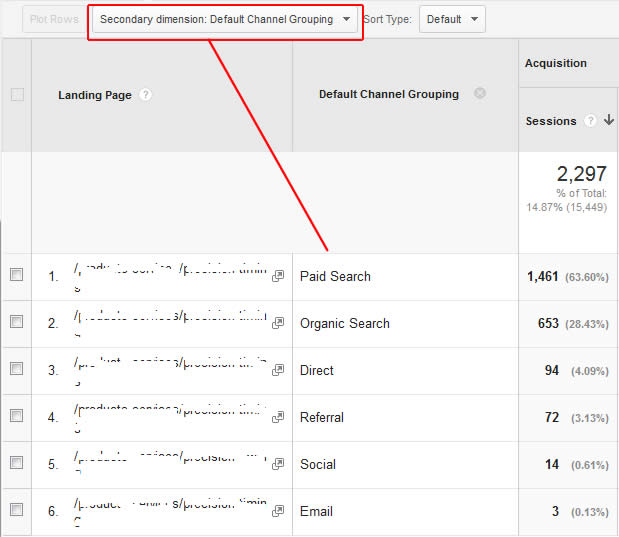
Figure 3
So far our segments have been based on those available from the standard Google Analytics reports. But Analytics also has the indispensable Custom Segments feature, which you can access via the “+ Add Segment” button that appears near the top of most reports (Figure 4).
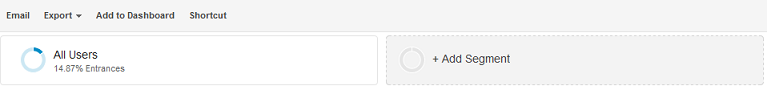
Figure 4
Custom segments are very powerful and allow you to combine multiple conditions into a single filter.

Figure 5
The custom segment shown in Figure 5 will apply a filter to all of my reports, showing just those sessions that were on mobile devices AND came from organic search results.
Segmentation is an important part of getting past “reporting” and into “analysis.” When you see a data trend that you don’t understand, start segmenting the sessions in question as many ways as you can think of, and you’ll likely find clues as to the cause.